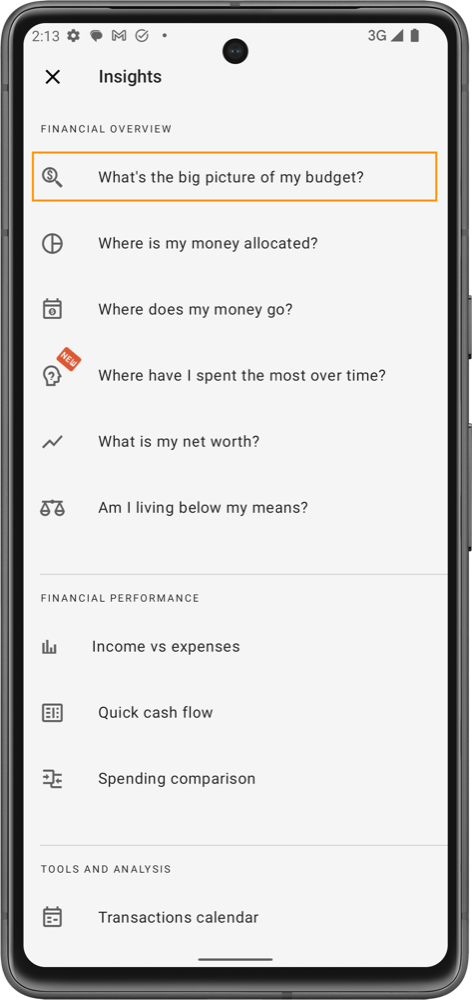
What's the big picture of my budget?
The "What's the Big Picture of My Budget?" insight offers a comprehensive overview of your finances, breaking down how your money is being allocated, spent, and saved. It uses simple, visual charts and graphs to help you understand your budget at a glance.
Top Allocations & Top Spending
- Top Allocations: This chart shows how much money you’ve planned to allocate for different categories like housing, groceries, savings, and entertainment. It helps you see where most of your money is supposed to go.
- Top Spending: This chart, on the other hand, shows where you are actually spending the most money. It compares your spending to your planned allocations, helping you notice if you're spending more in certain areas than expected.
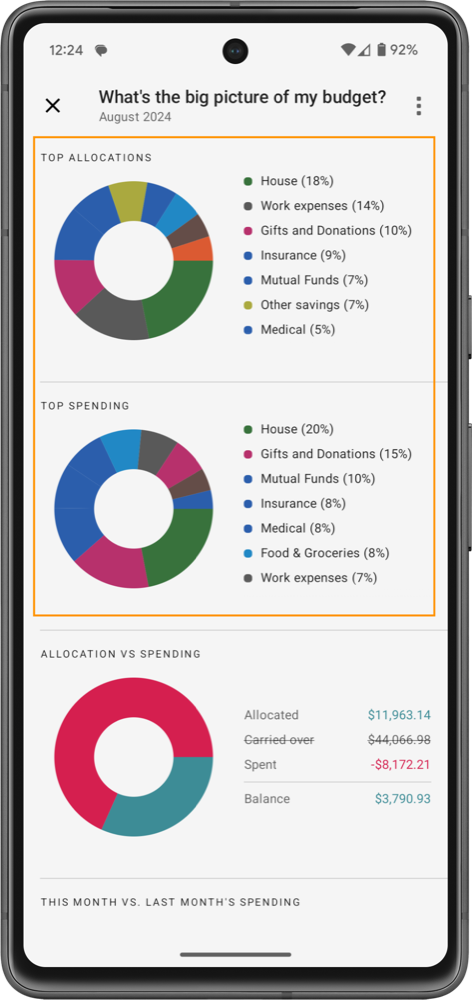
Allocation vs. Spending
- Purpose: This section compares the money you’ve set aside (allocated) for different categories with the amount you've already spent. It gives a quick snapshot of whether you’re staying within your budget or overspending.
- Example: You’ll see if you have money left over in certain categories or if you need to adjust your spending to avoid going over budget.
In the Allocation vs. Spending section, you can click on the Carry Over amount to include or exclude it from your budget. This is particularly helpful for months when you reach your savings target and want to start using those funds for the goal you were saving toward.
.png)
Historical Top Spending
- Purpose: This area tracks your biggest spending categories over the past few months. It helps you identify spending trends—like if you’ve consistently spent a lot on dining out, transportation, or utilities. Understanding these trends allows you to adjust your budget for future months.
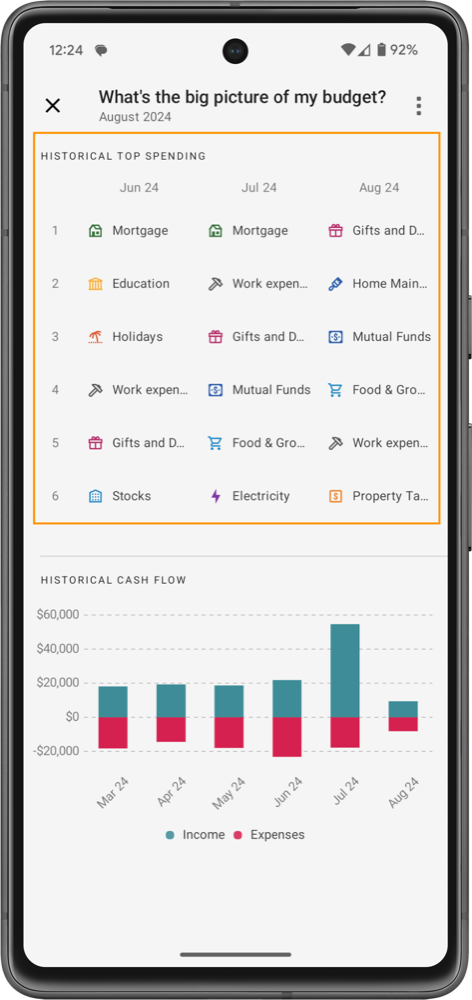
Historical Cash Flow
- Purpose: This graph shows your income versus expenses over several months. It helps you see if you're regularly earning more than you spend, or if you're consistently spending too much. Tracking this over time gives you a clearer picture of your overall financial health and whether you’re on track with your savings and expenses.
.png)
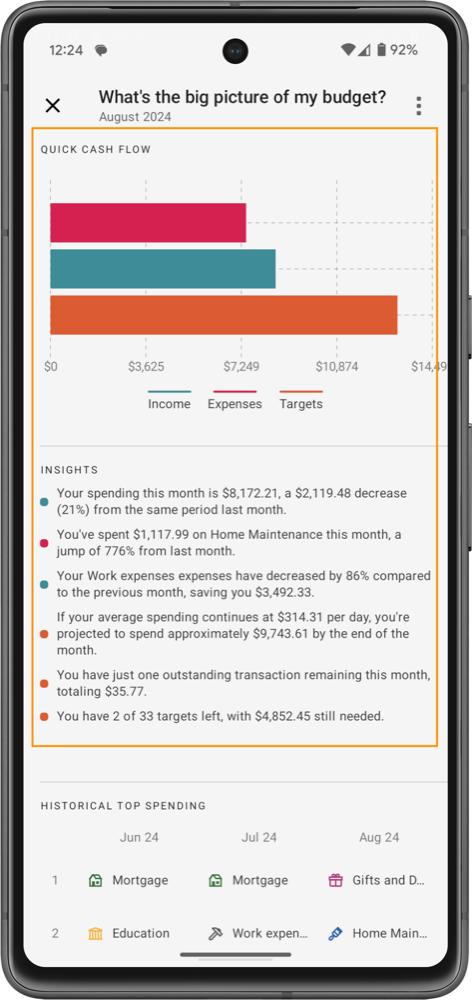
Quick Cash Flow & Insights
- Quick Cash Flow: A simple bar graph that shows your income, expenses, and targets for the current month. This gives you a quick, high-level overview of how well you're balancing your finances at the moment.
- Insights: This section offers specific takeaways from your current budget. For example:
- Spending Trends: You might get notified that your spending this month is lower than last month, helping you feel reassured or see room for further improvement.
- Category-specific Alerts: If you’ve been spending more than usual on a certain category, the app will let you know, prompting you to re-evaluate that area of your budget.
- Predictions: The app might try to predict how much you’ll spend by the end of the month based on your current habits, giving you the chance to adjust before things get out of hand.
- Reminders: It can also remind you about unallocated funds or incomplete savings goals, ensuring nothing slips through the cracks.
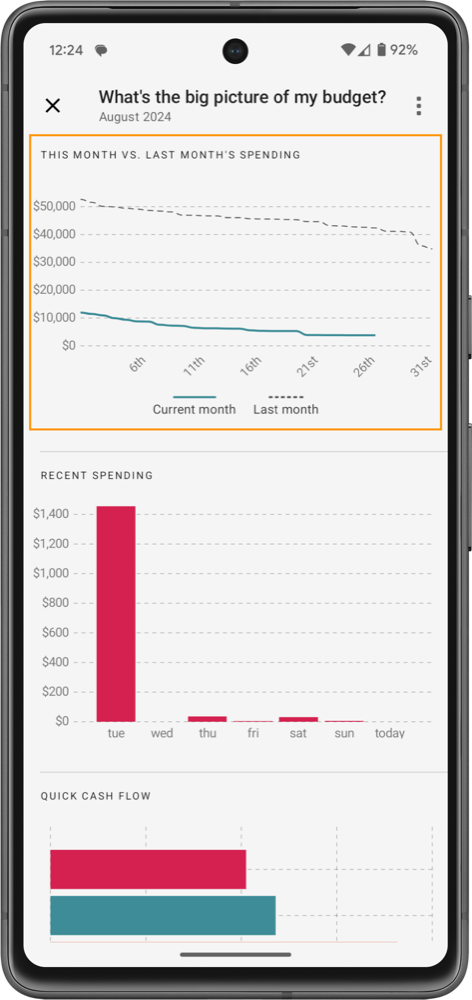
This Month vs. Last Month’s Spending
- Function: A simple line graph that compares your spending from this month to last month, helping you spot any shifts in your financial habits. For instance, you might notice that your spending has decreased compared to the previous month, signaling better budgeting.
These insights provide an easy-to-understand breakdown of your finances, even if you don’t typically focus on the numbers. They help you manage your budget more effectively by giving you a clear picture of your financial situation and offering suggestions for improvement.
.png)
This feature is partially available on the free plan, but to unlock full access to all detailed insights, you'll need to upgrade to the Pro plan.