Quick cash flow
Quick cash flow gives you a fast summary of your income and expenses over several short periods side by side, so you can see how your money moved recently without picking dates.
To open it, go to Insights and tap Quick cash flow under Financial performance.
What you'll see
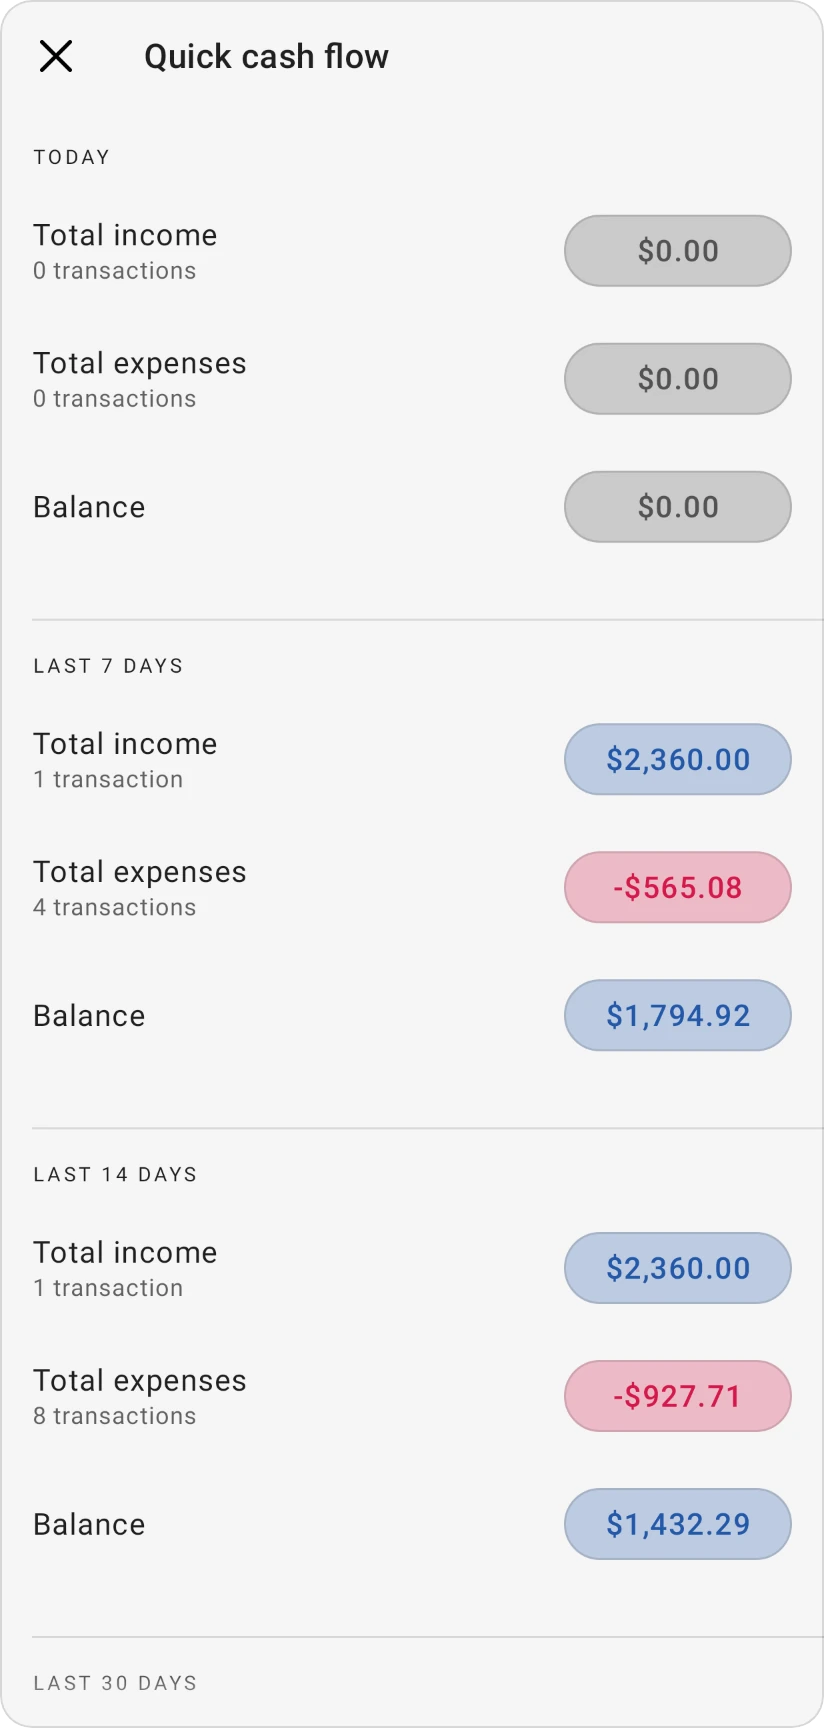
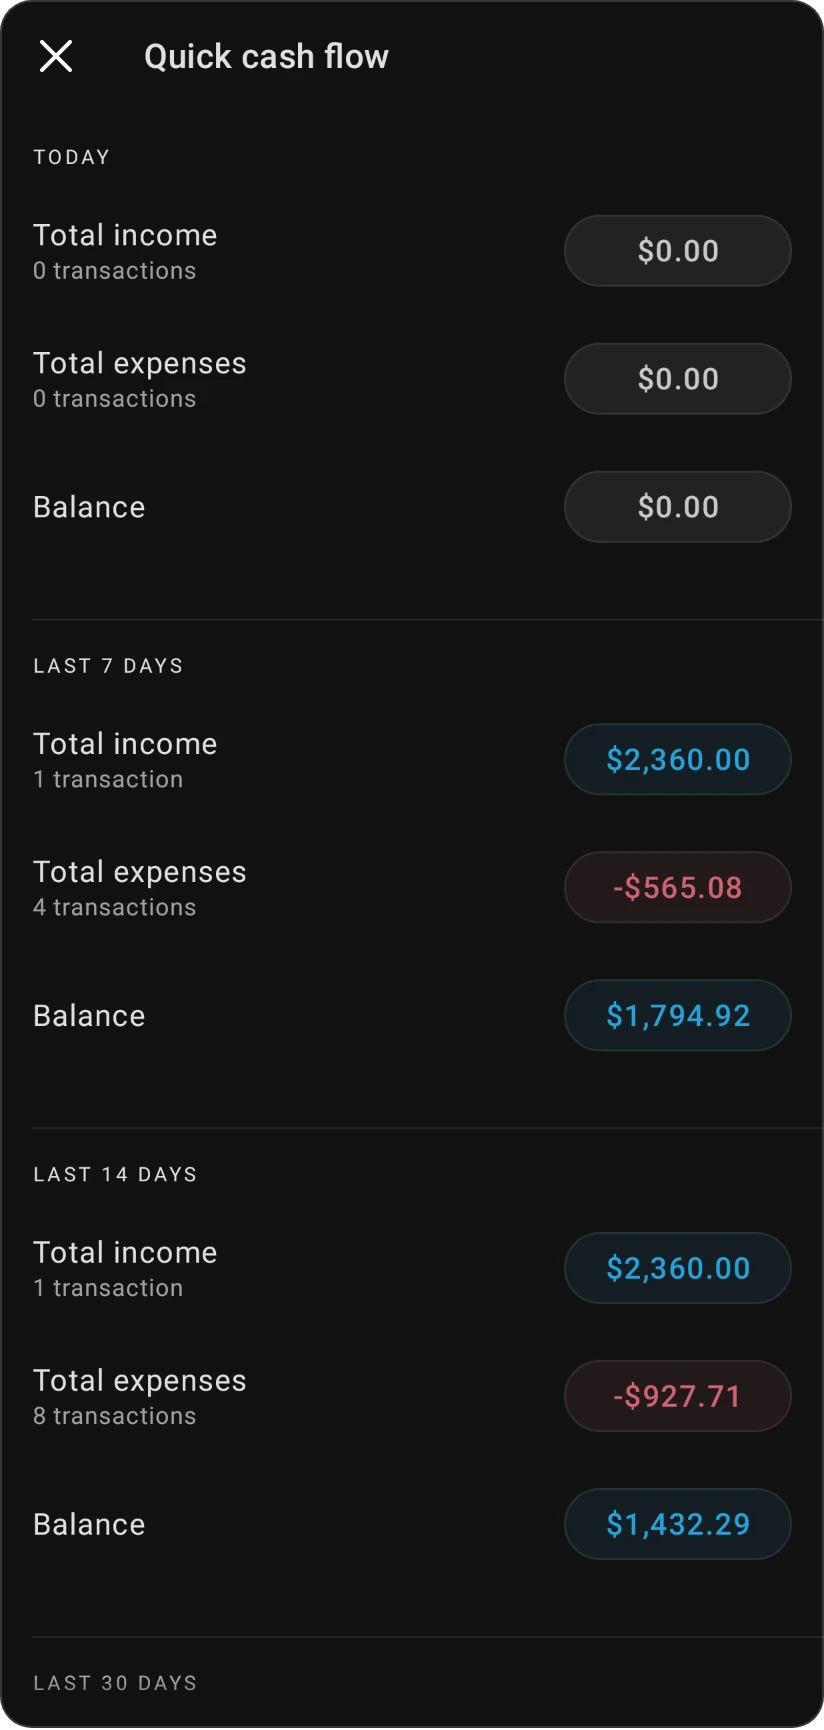
A card for each of these periods (periods with no transactions are left out):
- Today
- Last 7 days
- Last 14 days
- Last 30 days
- This month
- Last month
- Last 2 months
- Last 3 months
Each card shows:
- Total income and Total expenses, with the number of transactions
- Balance: income minus expenses. Positive means you're in the green for that period; negative means you spent more than came in.
Tap an amount to see the transactions behind it.
Looking for the Quick cash flow bar chart of income, expenses and targets? It's part of What's the big picture of my budget? and the Budget summary on your home screen. See Savings rate below for the line under it.
Savings rate
The Quick cash flow bar chart (in the Budget summary on your home screen and in What's the big picture of my budget?) has a line that tells you how much of the month's income you kept, for example "Saved 18% of your income".
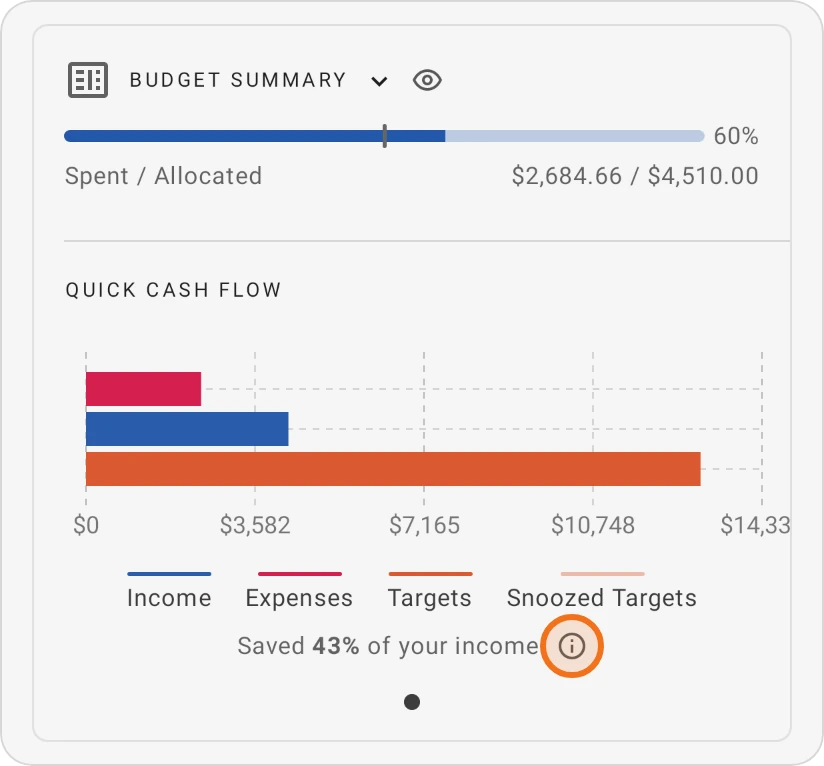
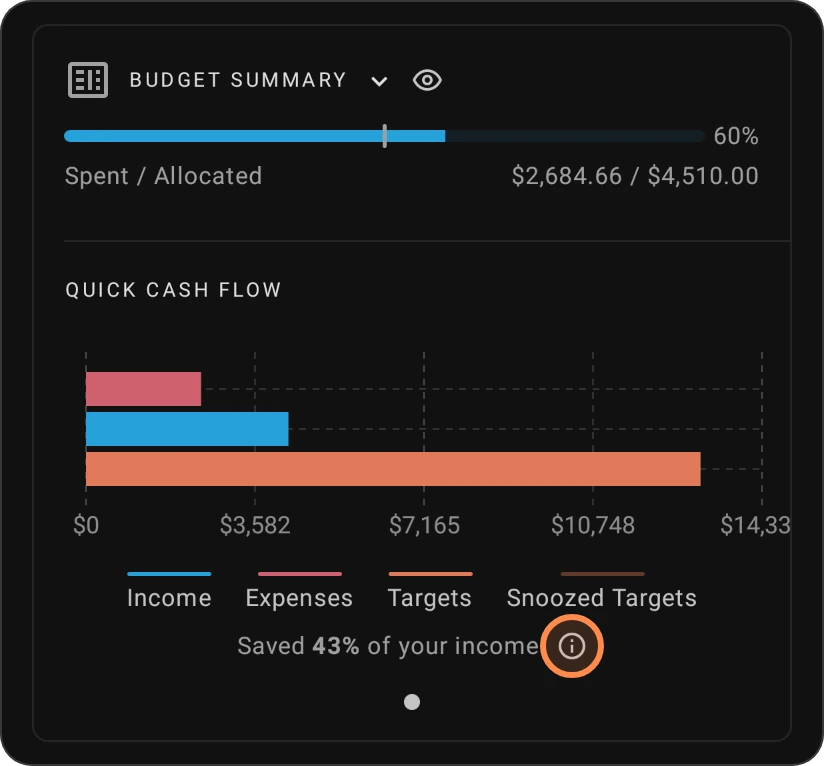
- It's income minus expenses, divided by income, rounded down. It uses the chart's own Income and Expenses, for the month selected in your budget.
- If you spent more than came in, it says so instead, for example "Spent 5% more than your income".
- With no income in the month, it says "No income yet this month", or "No income this month" once the month is over. A future month shows no line.
Tap the info button next to it for What counts:
- Moving money to a savings goal or to another of your accounts is a transfer, not spending, so it counts as saved.
- Credit card payments aren't counted: a card purchase already counts when you make it.
- Loan payments count as expenses.
- In Classic budgeting and Simple tracker, income is the amount allocated to your income categories for the month.
The savings rate shows on every plan. On the Free plan the chart itself is a locked sample, and the line sits above it with your own numbers.
For a longer view of whether you spend less than you earn, with tips to improve, see Am I living below my means?.
Free and Pro
Today and This month are free. The other periods are part of Pro; on the Free plan they show a lock instead of the amounts.