Spending Comparison
The Spending Comparison insight allows you to compare your spending between two different time periods, providing a clear visual of how your expenses have shifted.
Key Features:
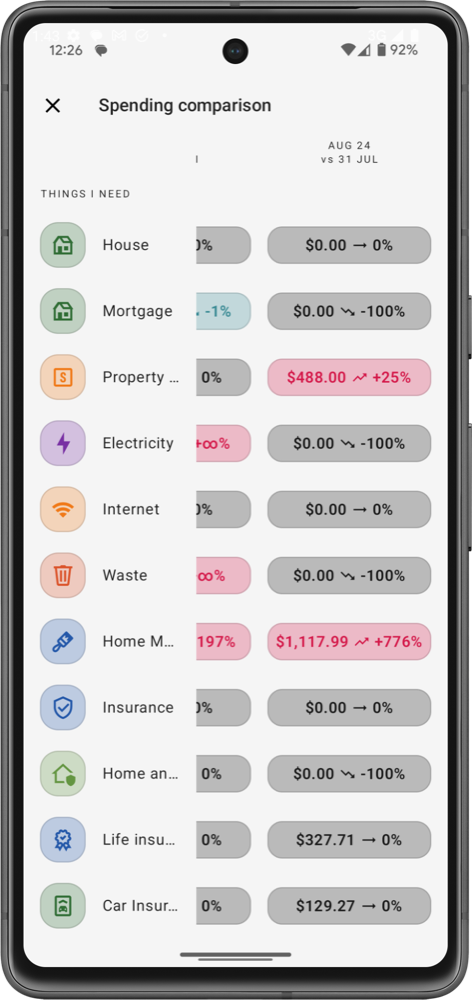
- Category Breakdown: The insight shows a list of spending categories, such as housing, utilities, insurance, maintenance and so on. Next to each category, you’ll see a comparison of your spending from one period (e.g., August) to the previous period (e.g., July). This makes it easy to spot areas where spending has increased or decreased.
- Percentage & Amount Changes: For each category, you get two key pieces of information:
- The percentage change shows how much your spending in that category has grown or shrunk.
- The amount change displays the dollar value difference between the two periods. This helps you quickly understand the scale of any changes in your spending habits.
- Visual Indicators: Positive or negative arrows alongside the figures indicate whether spending has gone up or down, providing an at-a-glance understanding of where your spending patterns have shifted.
By regularly reviewing this comparison, you can identify which areas of your budget need attention and adjust your spending accordingly to stay within your financial goals.
danger
The Spending Comparison feature is available exclusively on the Pro plan, offering in-depth insights into how your spending changes over time.
.png)
.png)