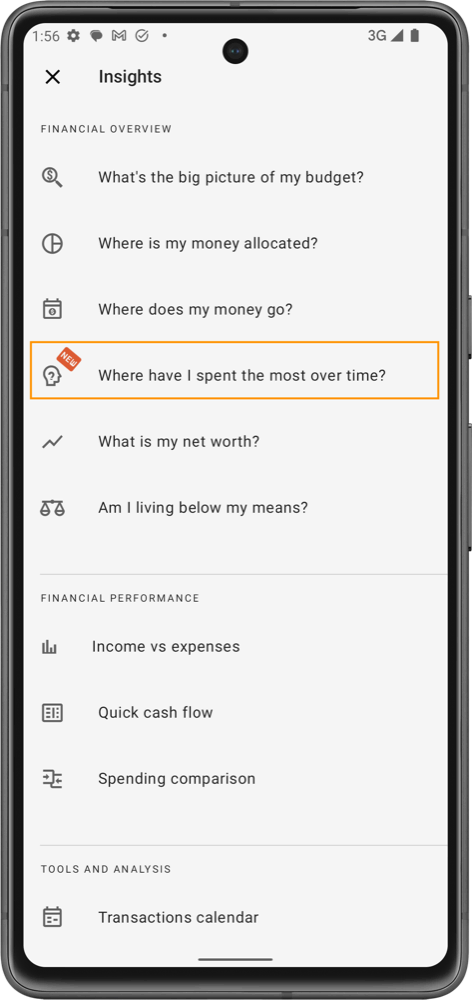
Where have I spent the most over time?
The "Where Have I Spent the Most Over Time?" insight provides a detailed view of your spending patterns across different categories over extended periods. This tool helps you see which areas consistently take up the largest portion of your budget.
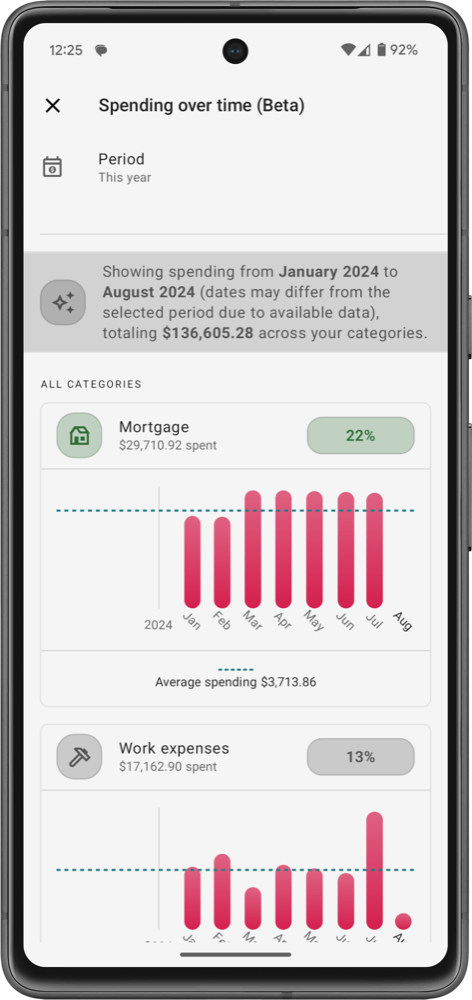
- Time Ranges: You can select various time frames for analysis, such as 3, 6, 12, 24, 36 months, this year or last year. This flexibility allows you to focus on short-term trends or gain a long-term perspective on your spending.
- Monthly Insights: By clicking on any bar in the spending chart, you can access additional insights for that month. These insights include:
- Total Spending for the Month: A clear view of how much you spent during that specific month.
- Comparison Against Your Average: See how that month's spending stacks up against your overall average spending, helping you spot anomalies or trends.
By utilizing these features, you can better understand your spending habits over time and make informed decisions about where you might want to cut back or reallocate funds.
info
By clicking on any bar in the spending chart, you can access additional insights for that month.
warning
This feature is partially available on the free plan, but to unlock full access to all detailed insights, you'll need to upgrade to the Pro plan.