Recent Spending
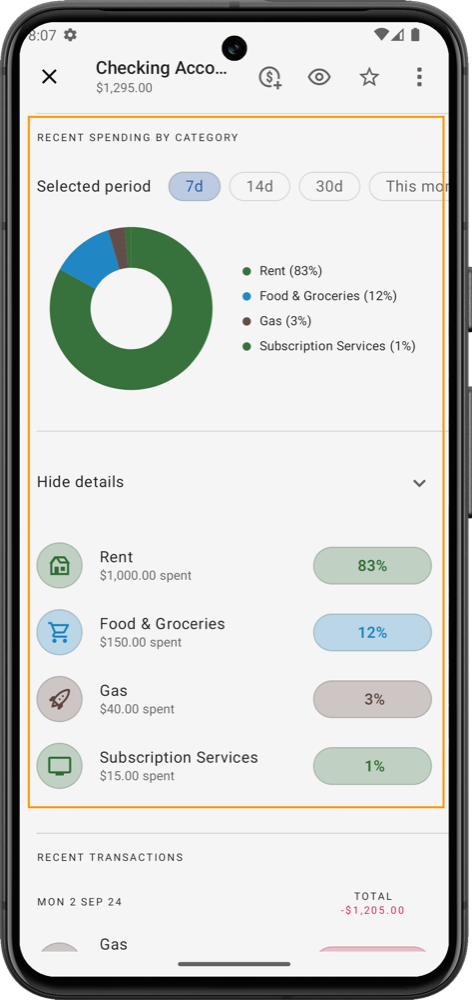
The Recent Spending by Category section provides a visual summary of how your money is being spent within a specific account, offering a breakdown of categories and their respective percentage of the total spending. This section helps you track where your money is going and allows you to make adjustments to your budget accordingly.
Key Features:
-
Selected Period: You can choose a time frame to analyze your spending. The default options include:
- 7 days
- 14 days
- 30 days
- This month
These periods help you focus on short-term or long-term trends in your spending.
-
Spending Breakdown: This is displayed both as a donut chart and a list. The chart provides a quick visual summary, while the list gives a detailed breakdown by category:
- Category Labels: Each expense category (e.g., Rent, Food & Groceries, Gas) is displayed with its respective spending amount.
- Percentage of Spending: Shows what percentage of your total spending each category accounts for. This is helpful for seeing which areas consume most of your budget.
-
Show/Hide Details: You can toggle to show or hide more specific details about the spending categories, allowing for a more streamlined view when needed.
This section gives you clear insights into how your budget is allocated and spent over time, empowering you to make informed decisions about your financial habits.