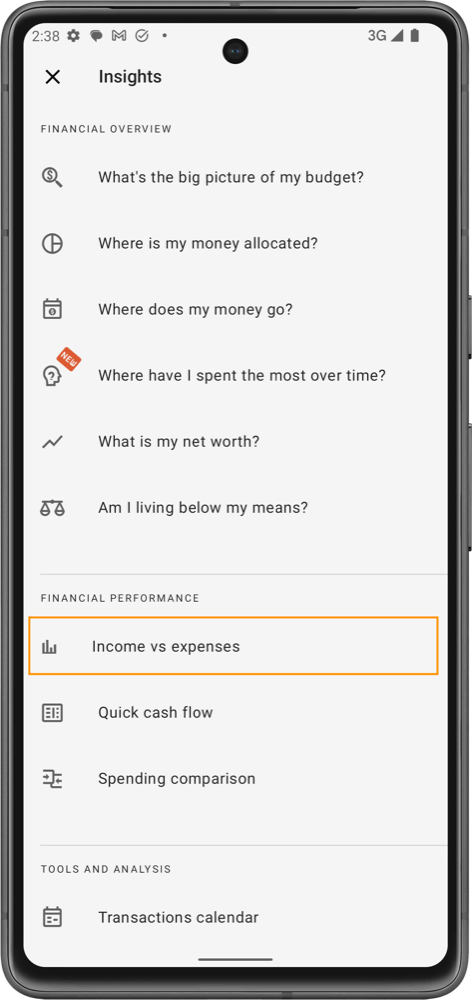
Income vs expenses
The "Income vs Expenses" insight provides a clear view of how your income compares to your spending over a selected period, helping you monitor your cash flow and manage your finances effectively.
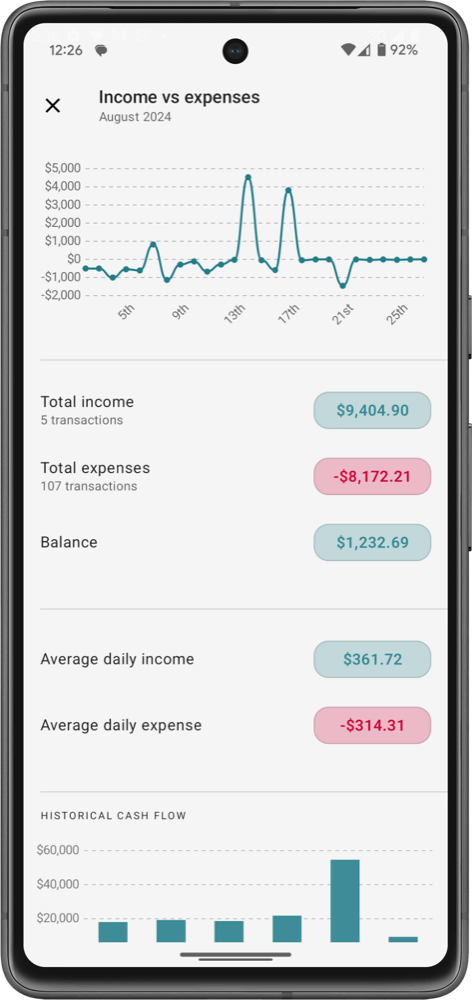
Key Features:
- Graphical Overview: The chart at the top visualizes your income and expense activity over time, showing peaks and valleys in your cash flow. This helps you quickly spot days where your income spiked or your expenses were higher than usual, allowing for easy identification of spending patterns.
- Total Income & Expenses: This section breaks down the total amount of money you've earned and spent during the period, including the number of transactions. It gives you an exact figure for both income and expenses, making it easy to see if you're spending more than you're earning.
- Balance: The balance shows the difference between your income and expenses. A positive balance means you have more income than expenses, while a negative balance indicates overspending. This gives you a quick snapshot of whether you're managing your money sustainably.
- Average Daily Income & Expense: These metrics show how much you earn and spend on average each day during the selected period. This information helps you understand your daily financial habits, giving you a more granular view of your income and spending behavior.
- Historical Cash Flow: The chart at the bottom provides a historical view of your cash flow, helping you see trends in your income and expenses over previous months. This can be useful for planning future budgets and identifying seasonal spending patterns.
By regularly reviewing this insight, you can stay on top of your financial health, ensuring that your expenses don't exceed your income and that you're making progress towards your savings goals.
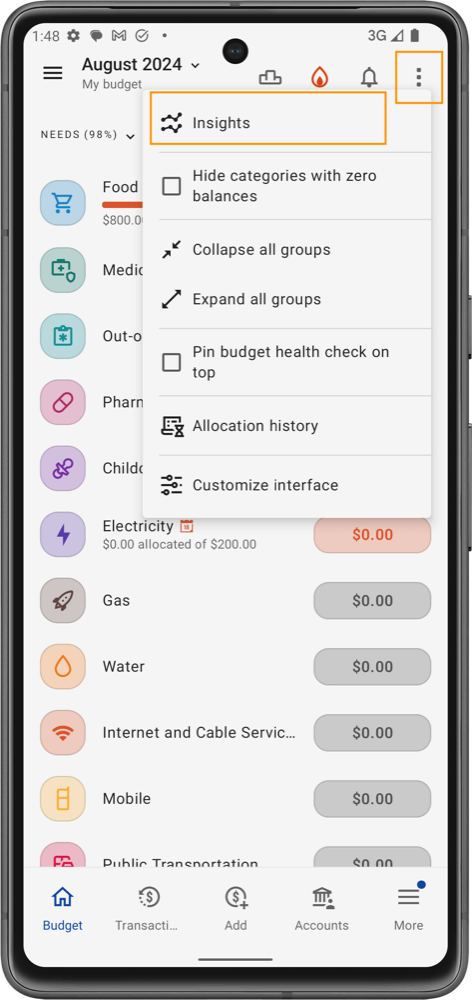
warning
This feature is partially available on the free plan, but to unlock full access to all detailed insights, you'll need to upgrade to the Pro plan.