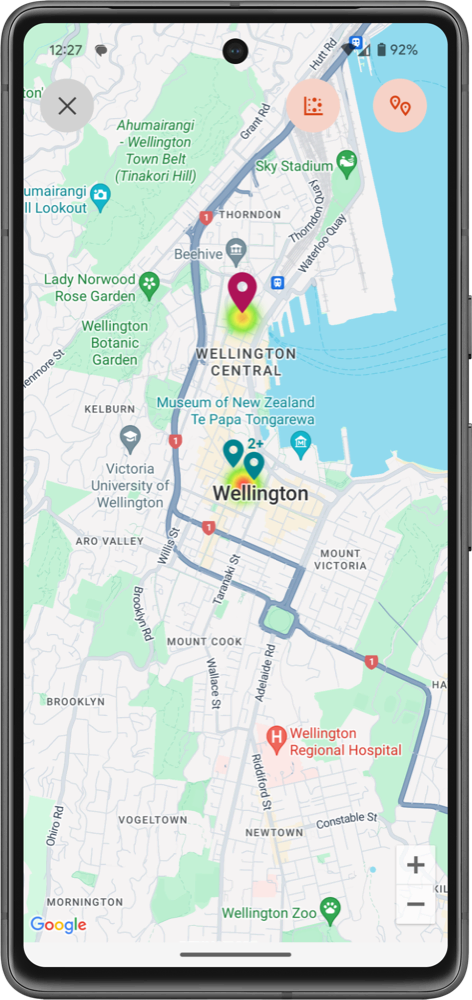
Transaction map
The Transaction Map displays a visual representation of where you’ve been spending, offering a Spending Heatmap that highlights your transaction activity across different locations.
Key Features:
- Spending Heatmap: The heatmap uses color intensity to show areas where you’ve spent the most money, with brighter colors representing higher spending. This allows you to quickly identify hotspots where most of your transactions occur.
- Location-Based Insights: By mapping out your transactions, you can gain valuable insights into where you’re spending your money geographically. This can help you recognize patterns in your spending habits, such as frequent visits to certain stores, restaurants, or service providers.
The Transaction Map is a powerful tool for visualizing your spending behavior in a geographical context, helping you better understand where your money goes and how your location influences your financial decisions.